


A migration, remapped by usage data
UX / Information Architecture
Jan – May 2026

Key issues in the legacy site
GA4 and a heuristic review surfaced three problems:
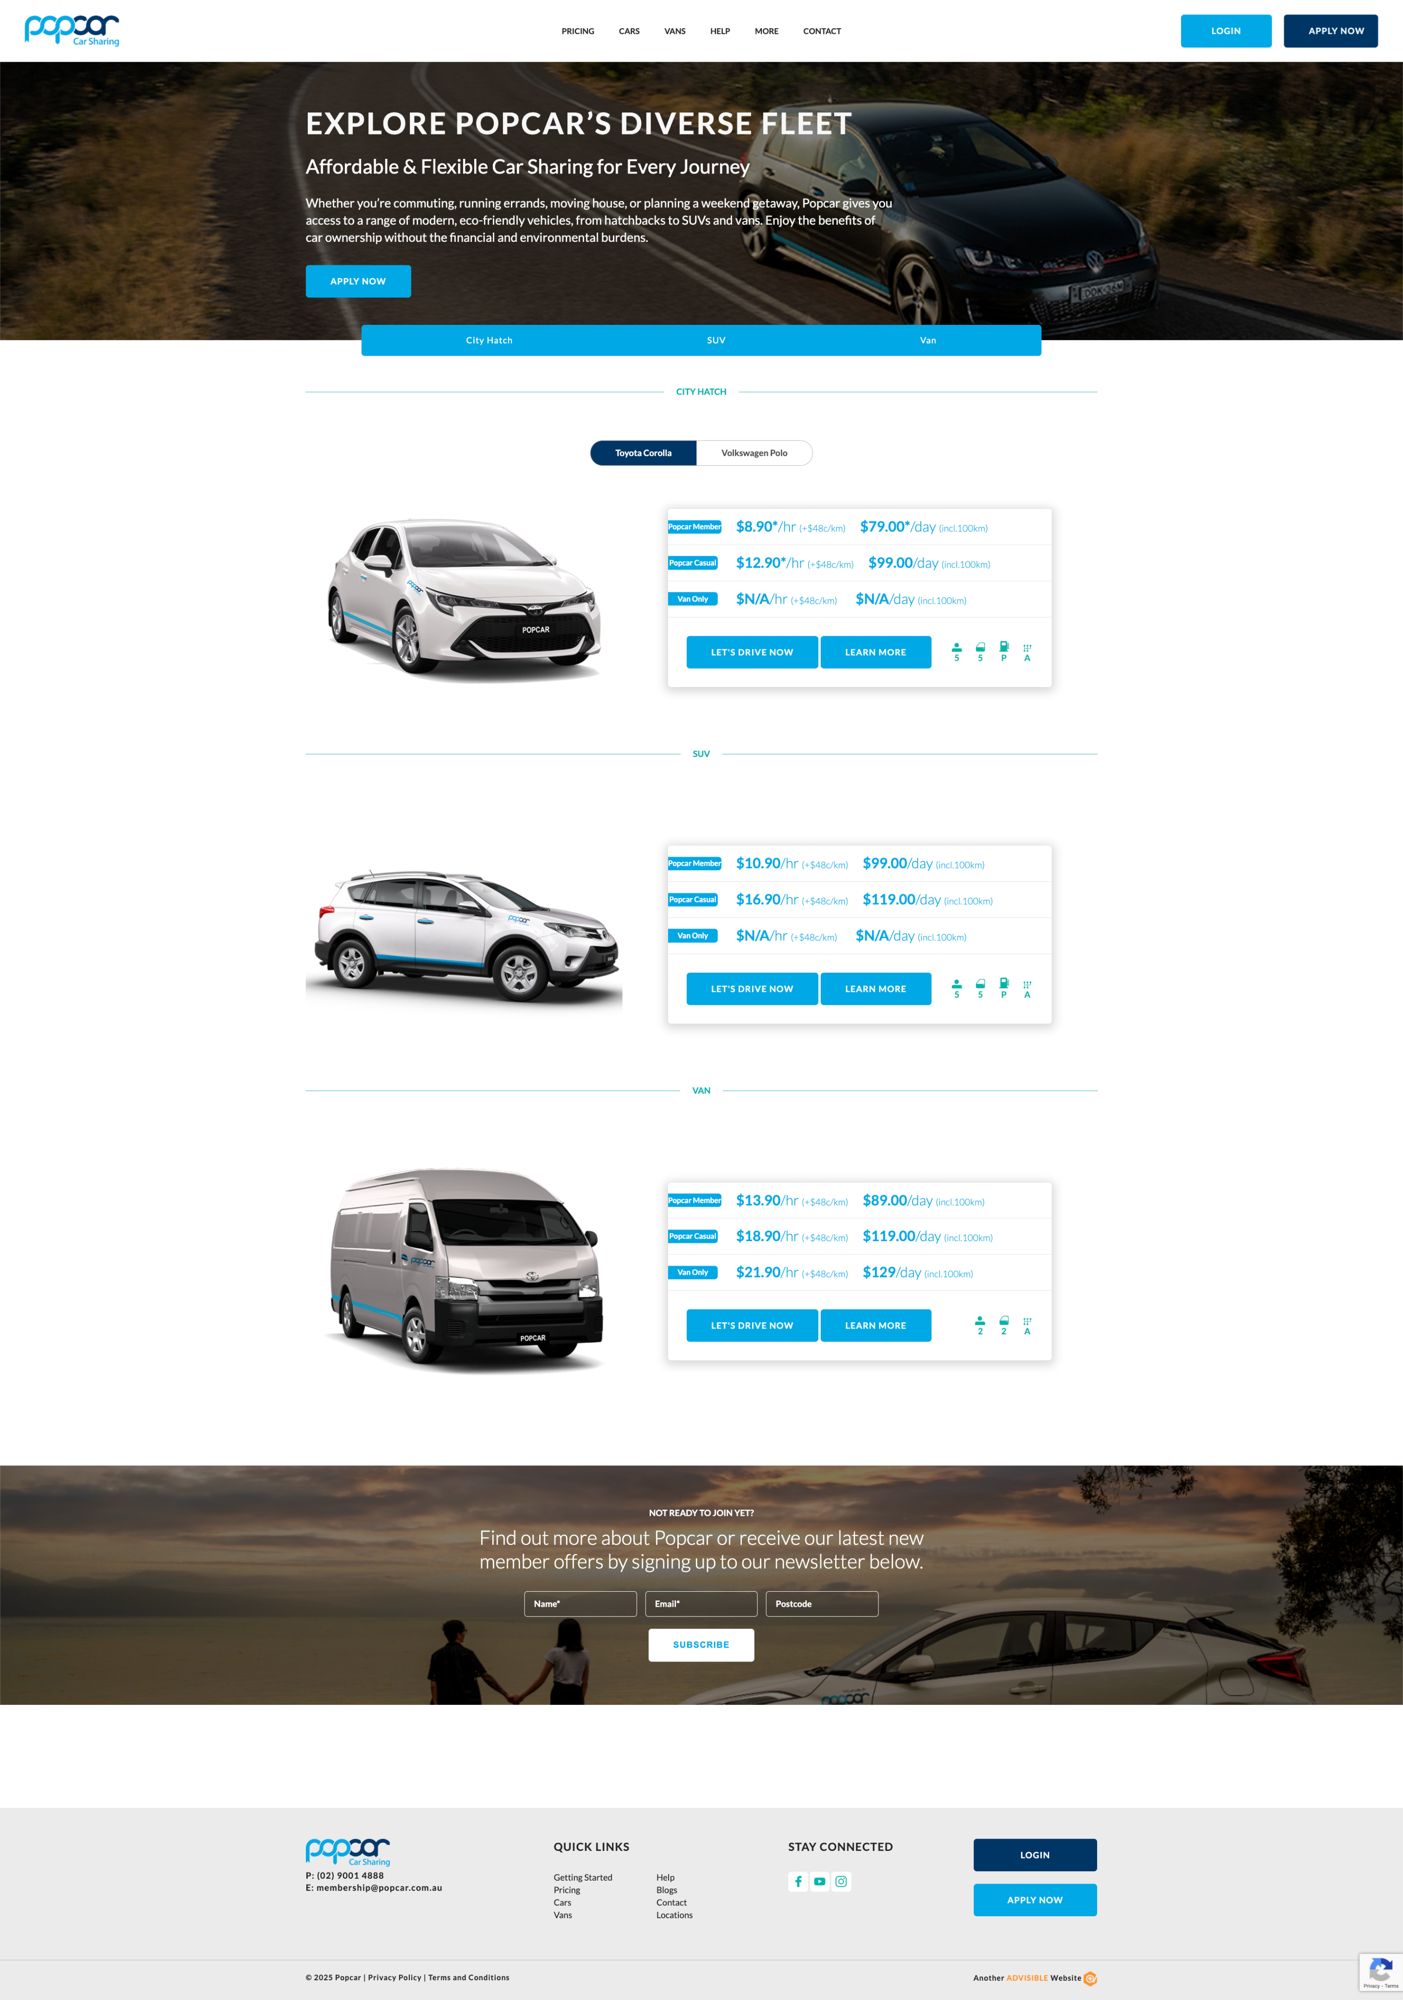
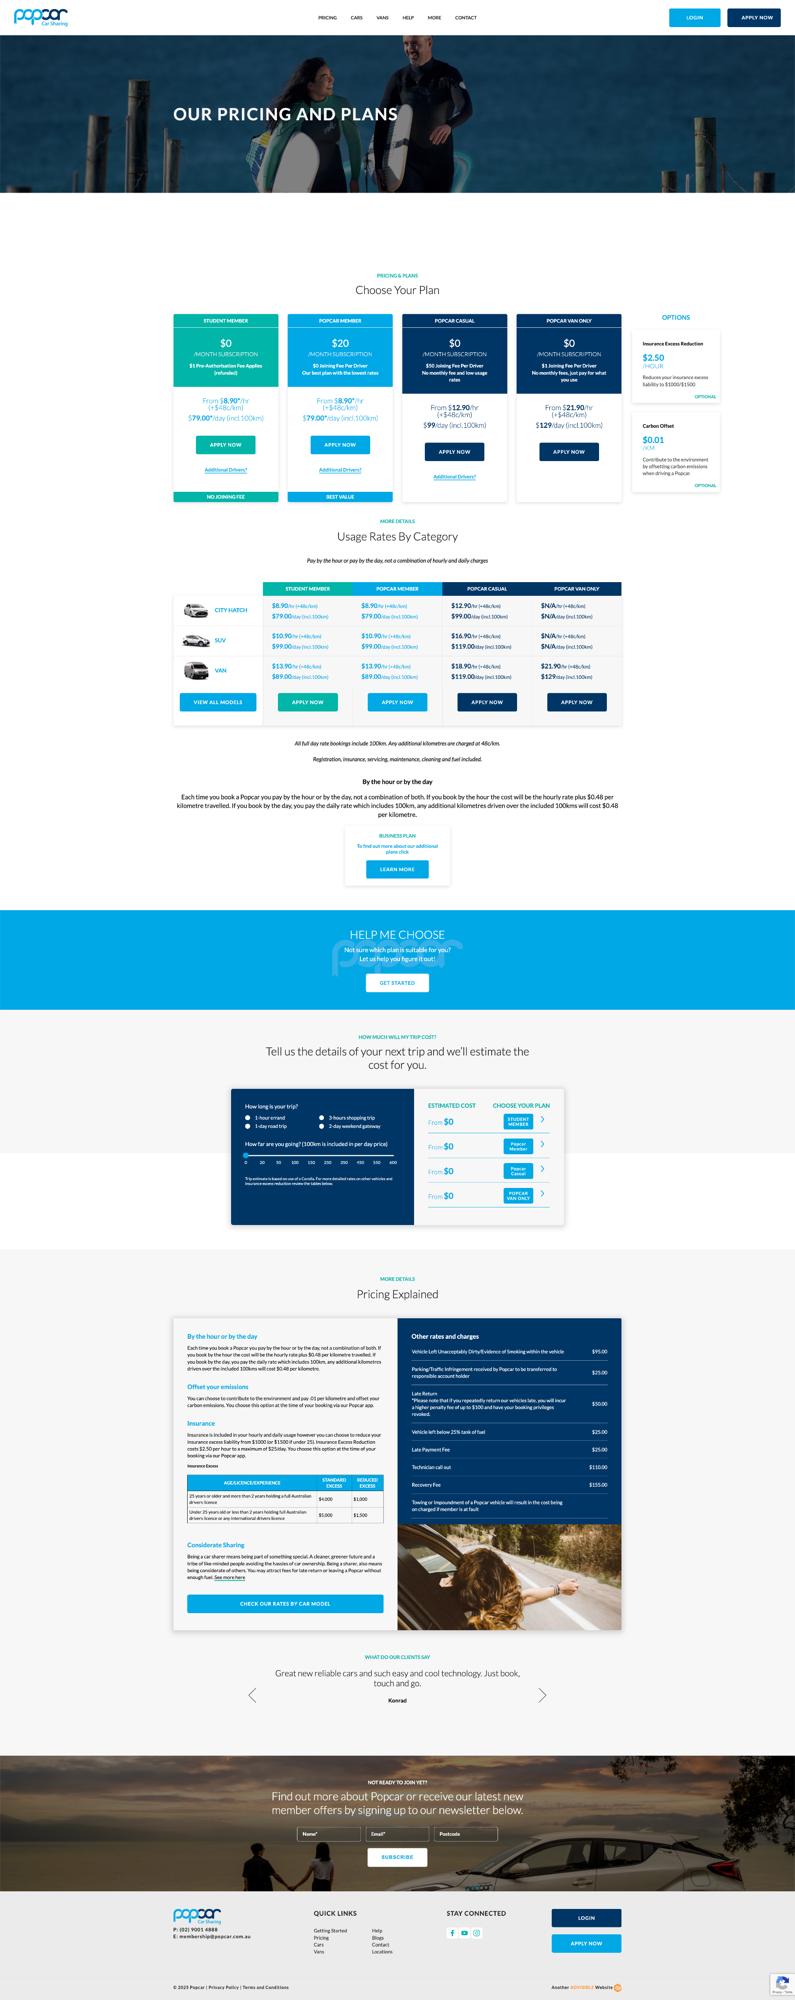
Pricing page drop-off
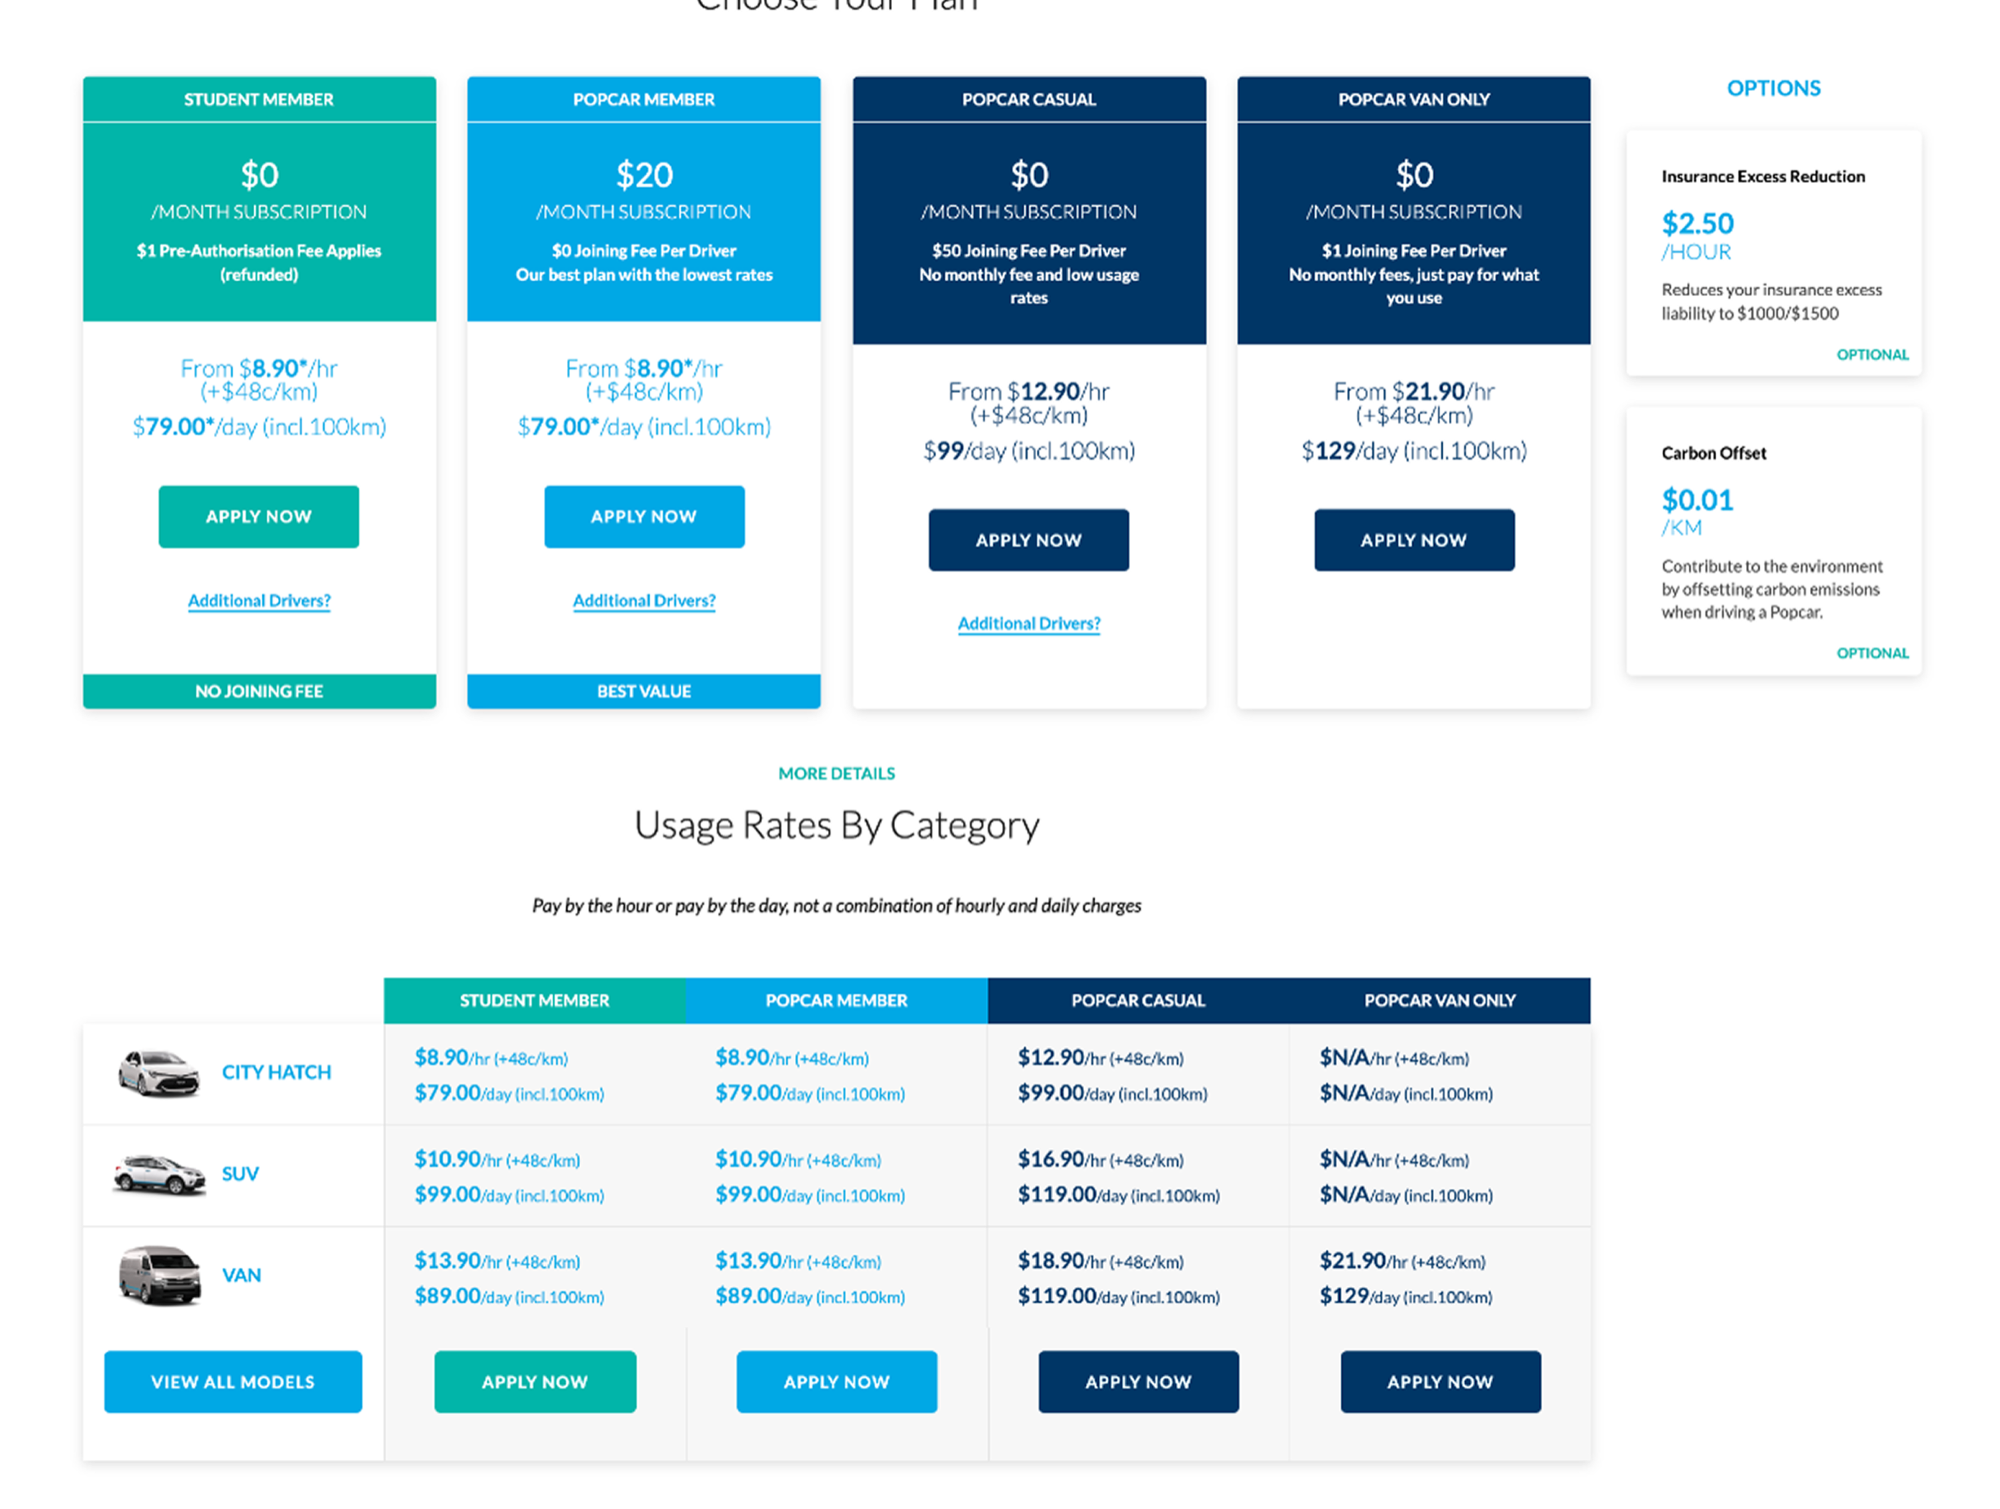
The pricing page was the second-most visited page but also the biggest exit point, with a 97.7% drop-off and only 2.3% week-one retention. The team hypothesized that this might have been due to the complexity of comparing membership tiers.
High cognitive load
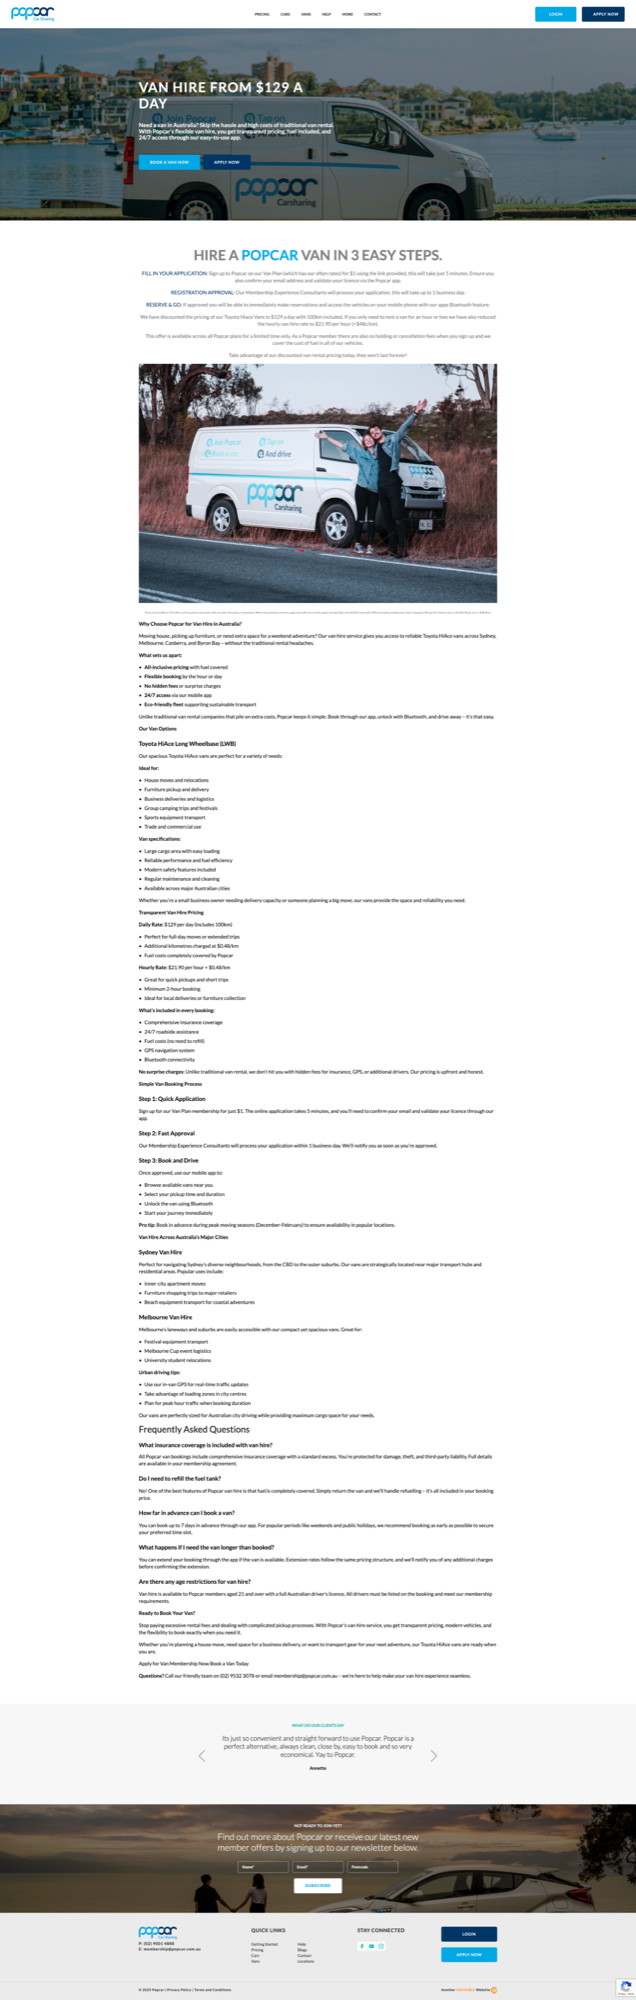
Users spent an average of about 45 seconds on the page they land on, before bouncing. This suggests that they are performing quick utility related tasks like checking prices, or that they're not able to find what they need on the pages they land on. This might be due to the amount of information that's presented on every page.
SEO traffic with no conversion
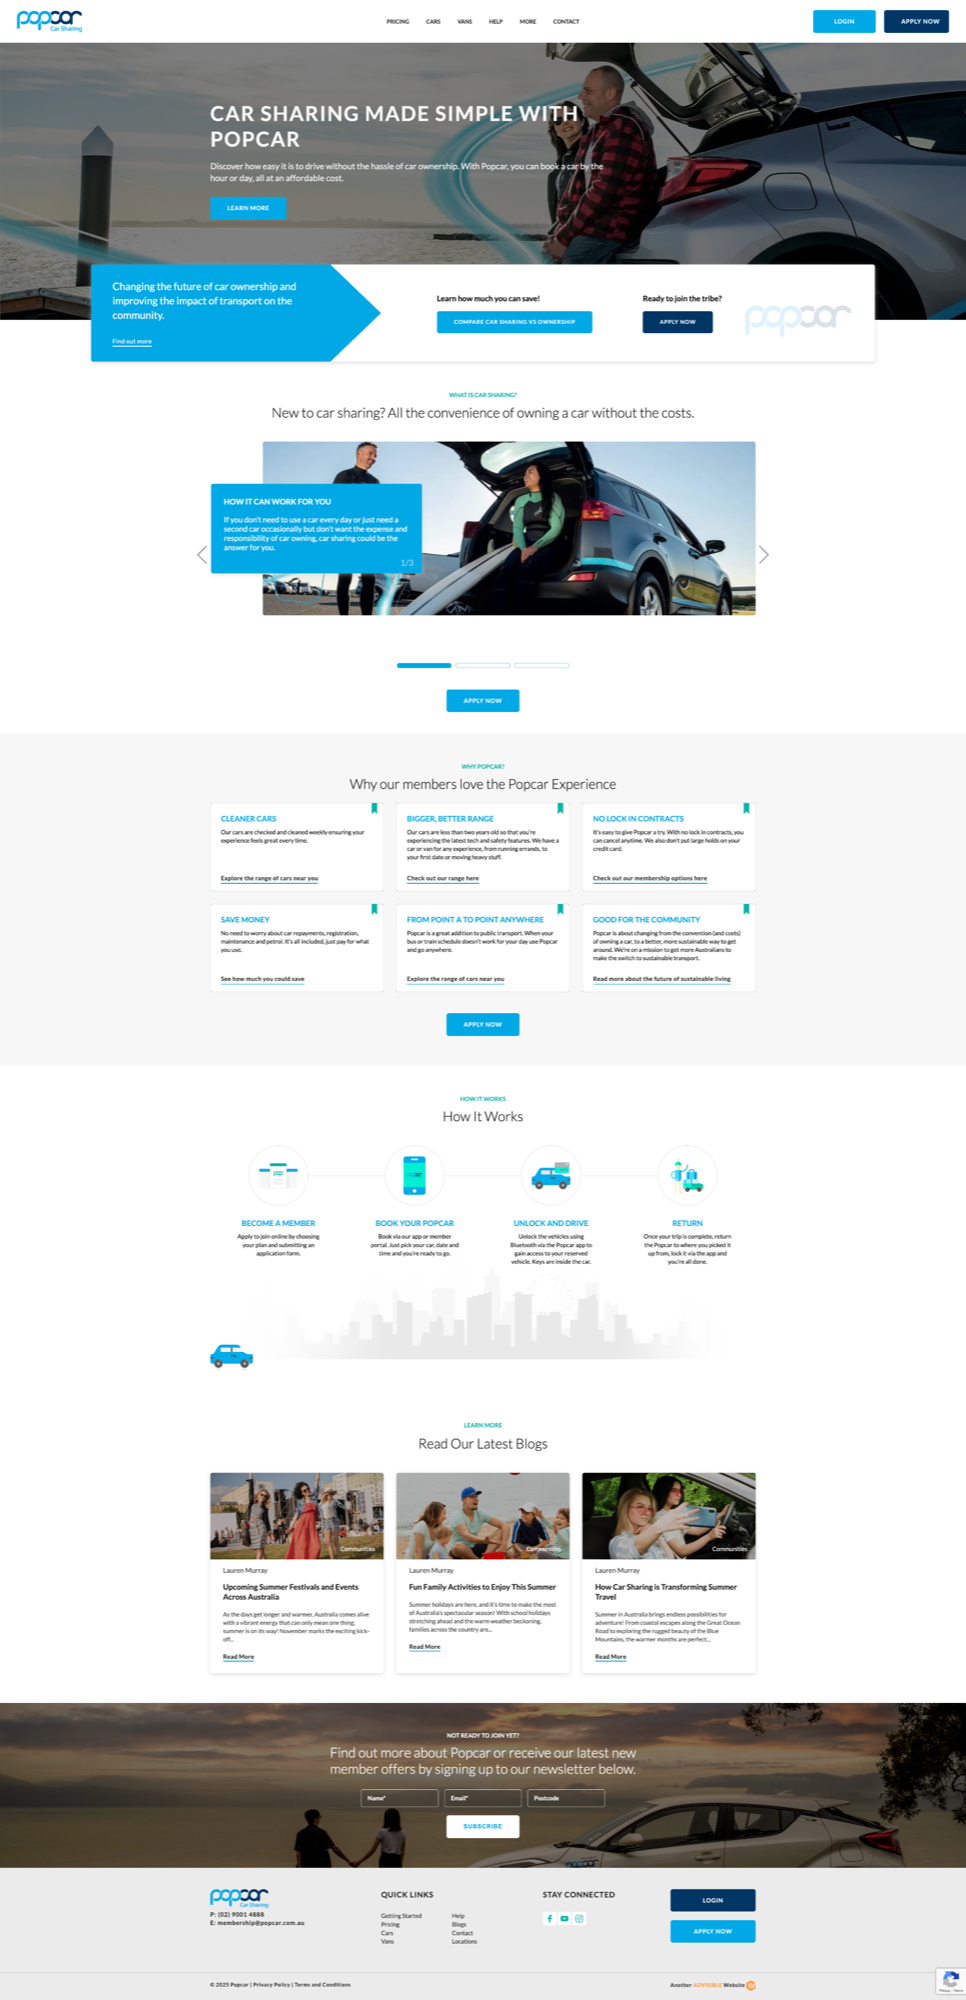
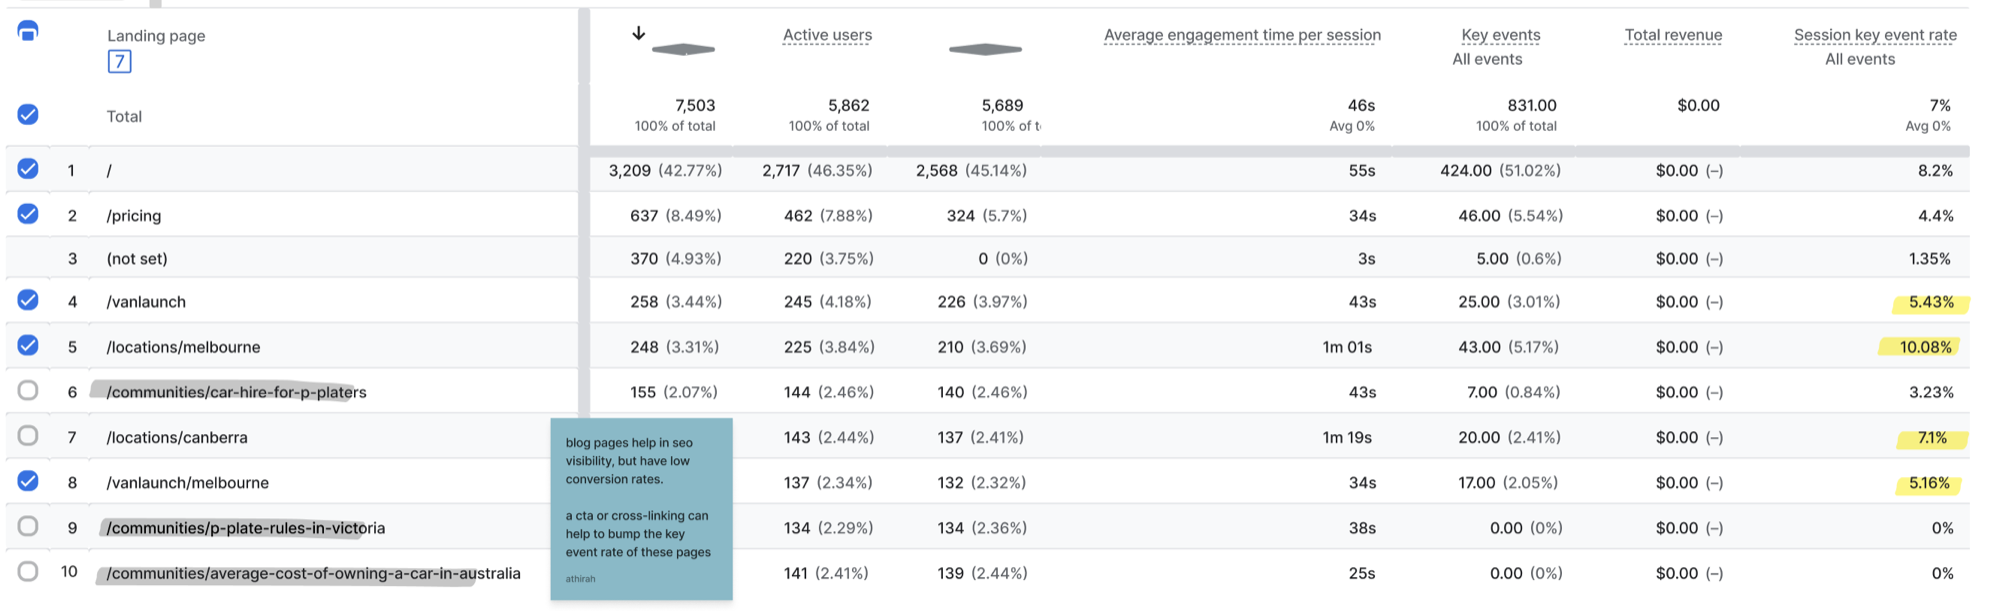
Blog posts attracted consistent organic traffic but converted at 0%, presumably because articles lacked clear pathways into the service.
Behavioral analysis
Using GA4 path exploration and traffic acquisition reports, I mapped four behavior patterns:
High-intent utility-driven users
(11.06% conversion)
Users from targeted ads looking for vehicles with specific use-cases
(e.g vans)
- High key event rates on focused landing pages
Location-specific users
(10.08% conversion)
Organic visitors prioritizing proximity of the vehicles to them
- High number of users landing on, and engaging with location-specific pages

and based on the insights from the key issues previously mentioned:
Price-sensitive users
(accounted for 26.26% of total page views)
Users interested in obtaining pricing information
Content-driven users
(accounted for 5.91% of landing page hits)
Users landing on the website from SEO-driven blog content
These segments became the backbone for the redesigned information architecture.
Redesigning the IA
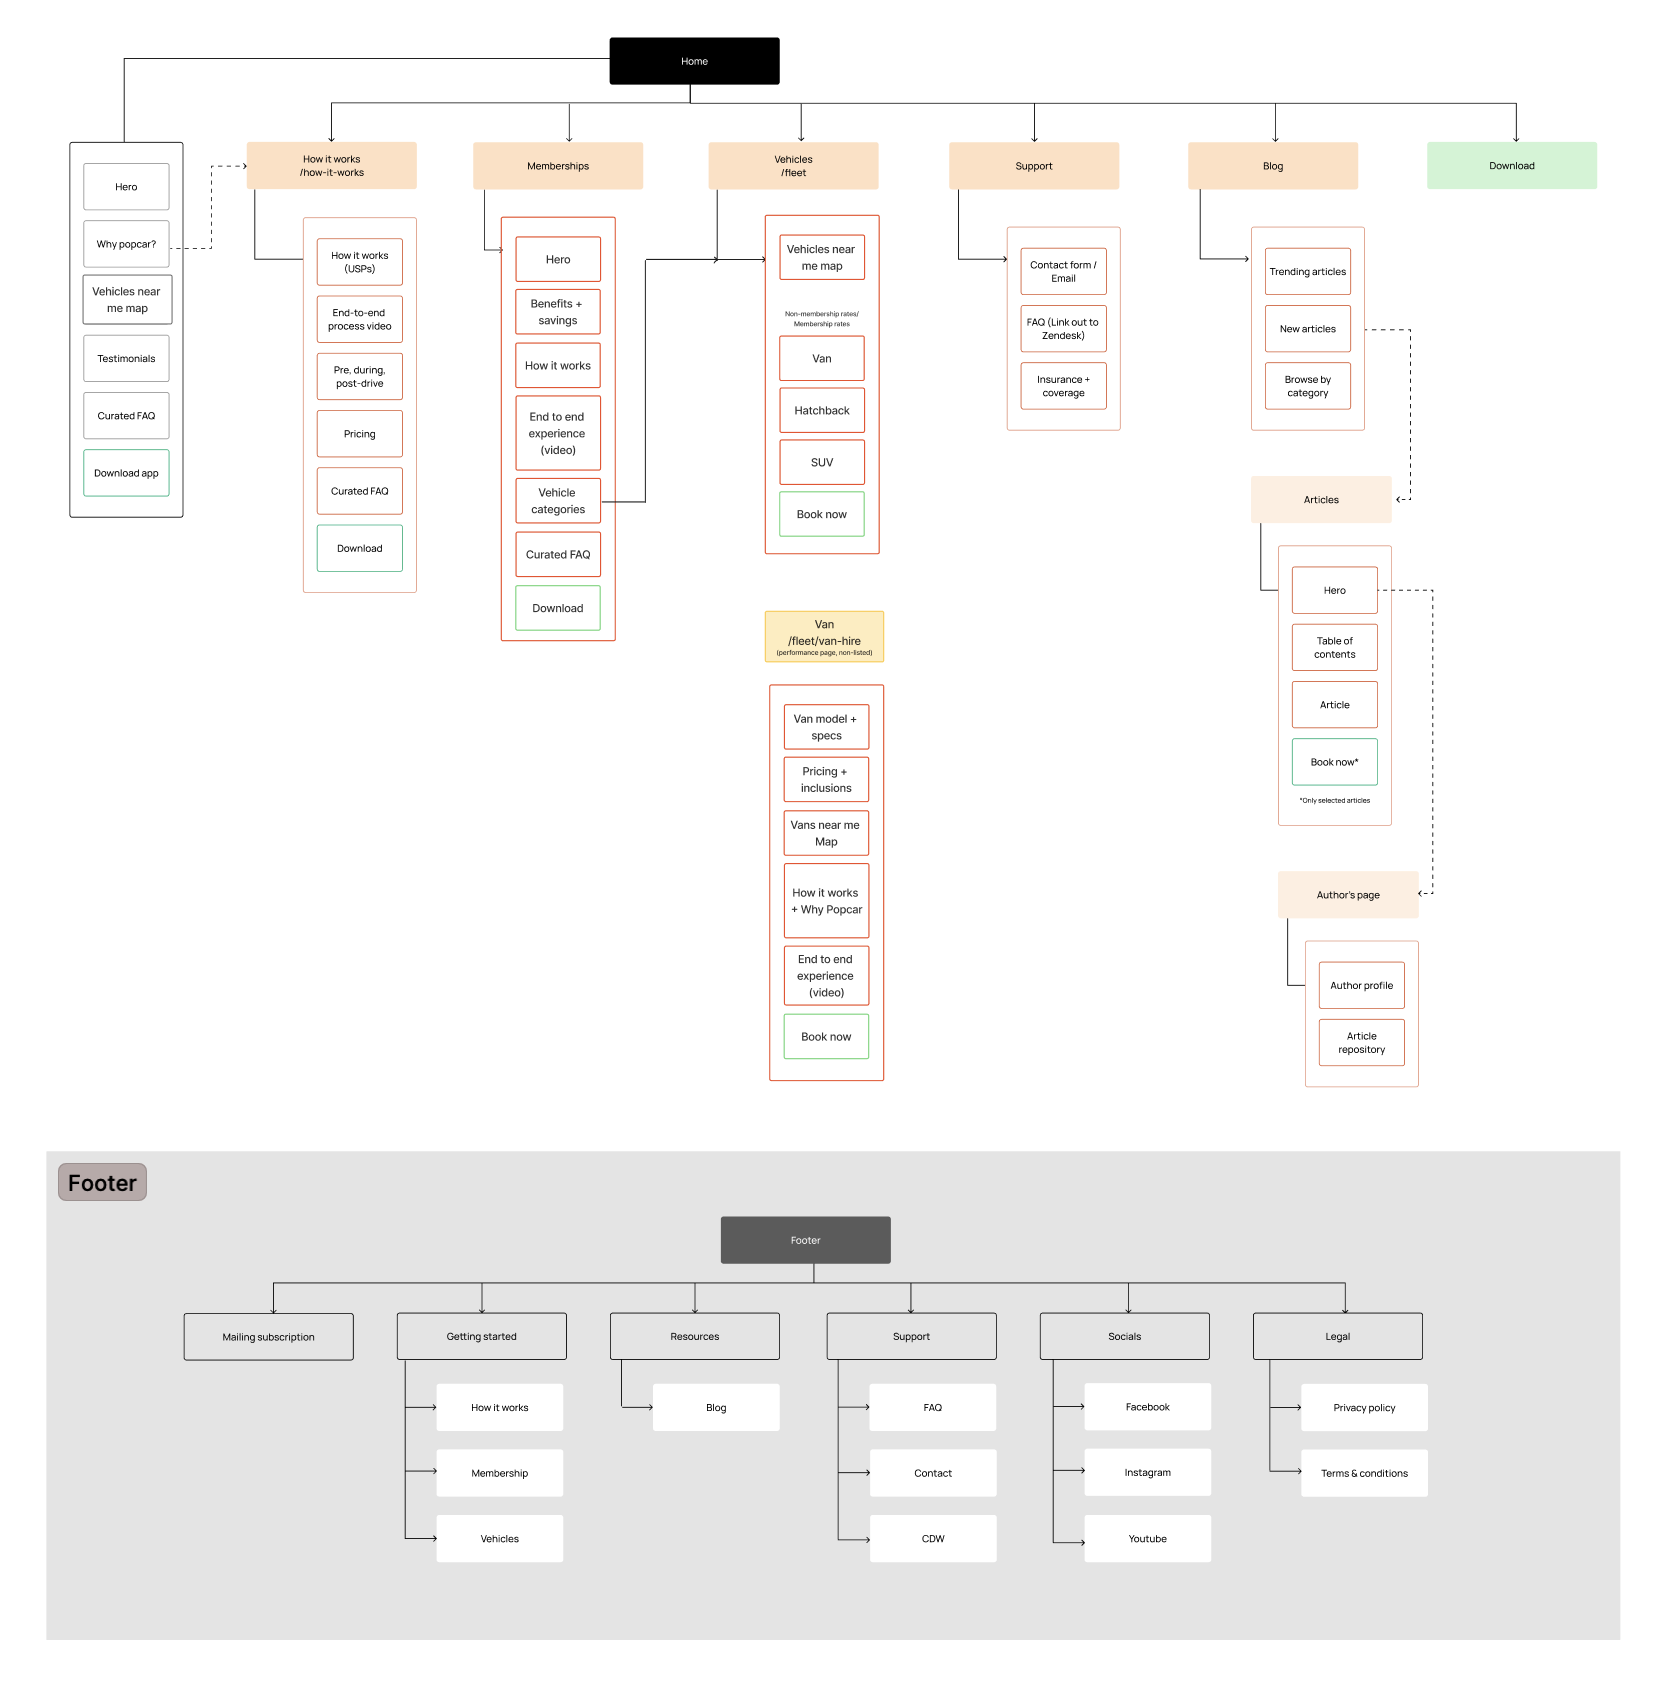
I mapped the legacy site in FigJam – annotating unclear page roles, content flows, and weak connections between informational and product pages. I also cross-referenced other Australian car sharing companies to better understand the demographic-specific considerations of the users.
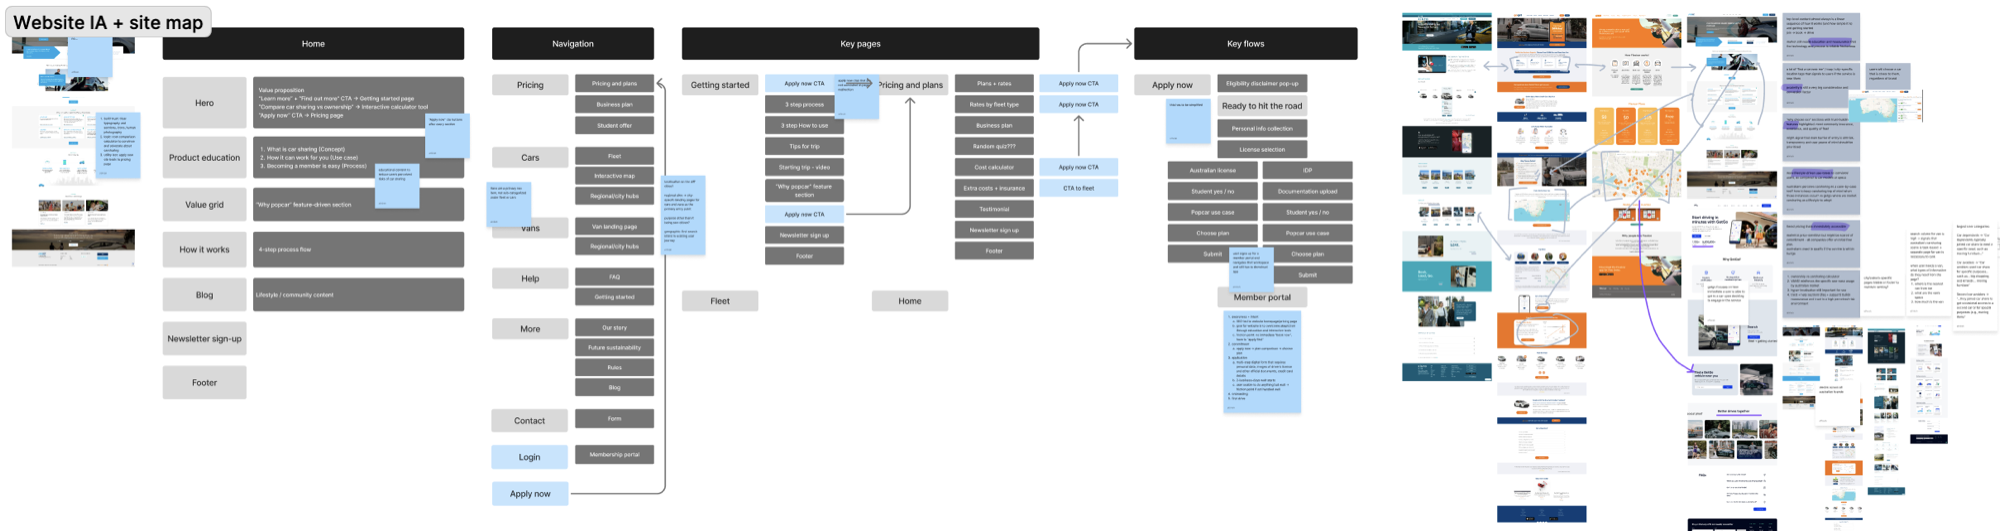
A closer look on some of the brain dumps :P
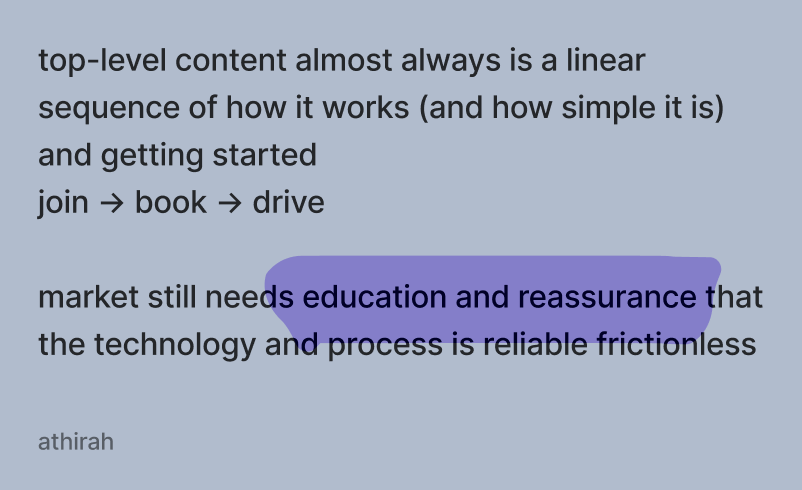
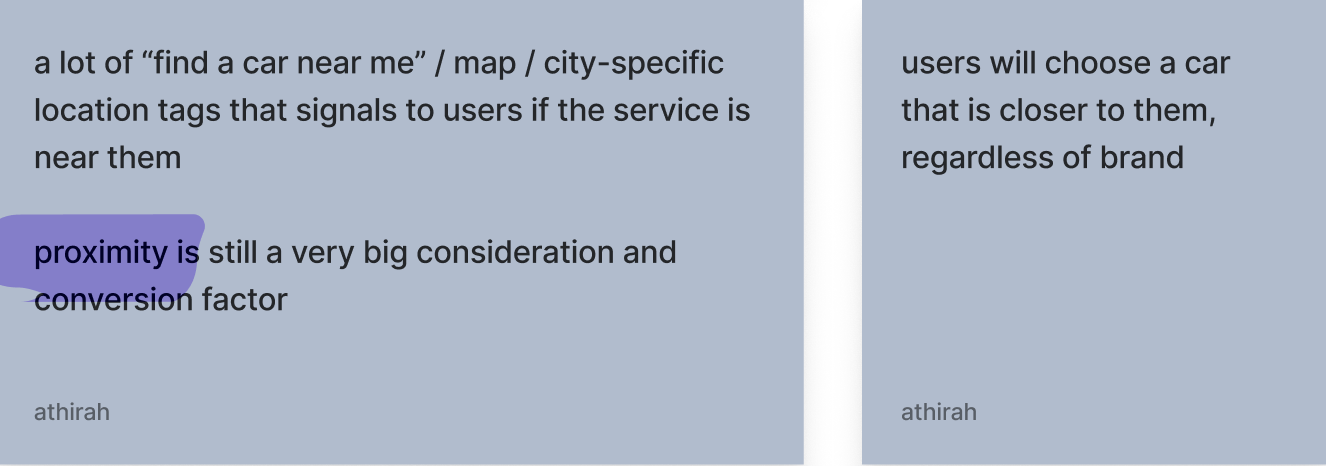

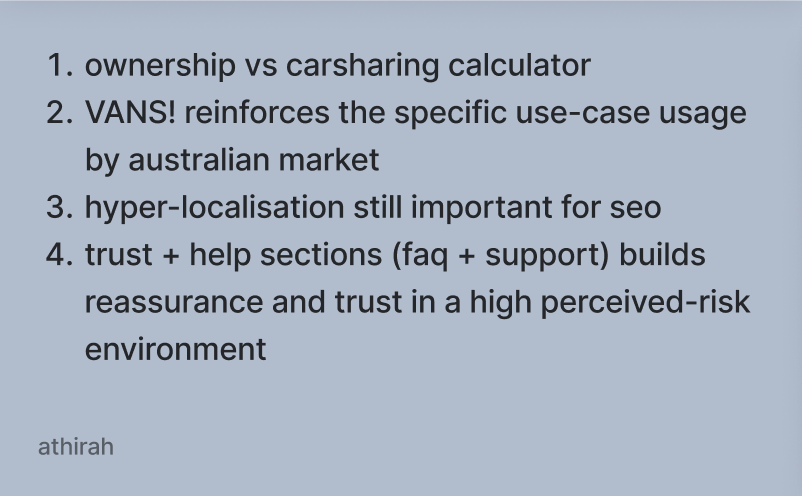
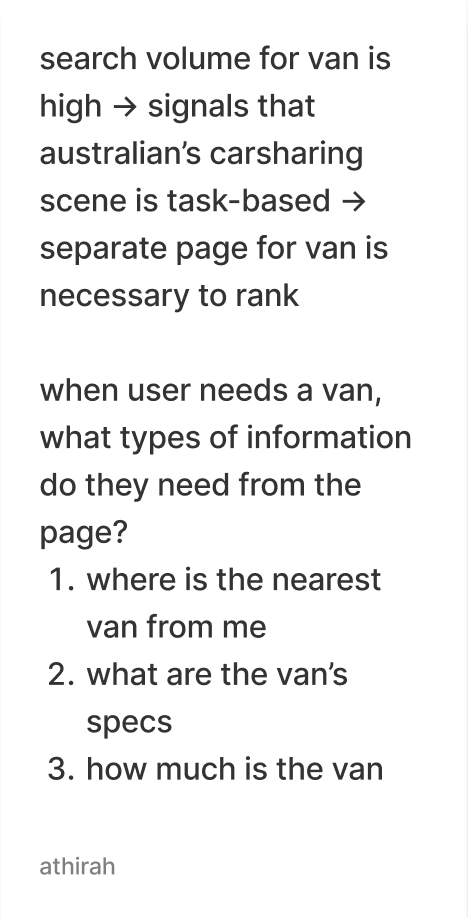
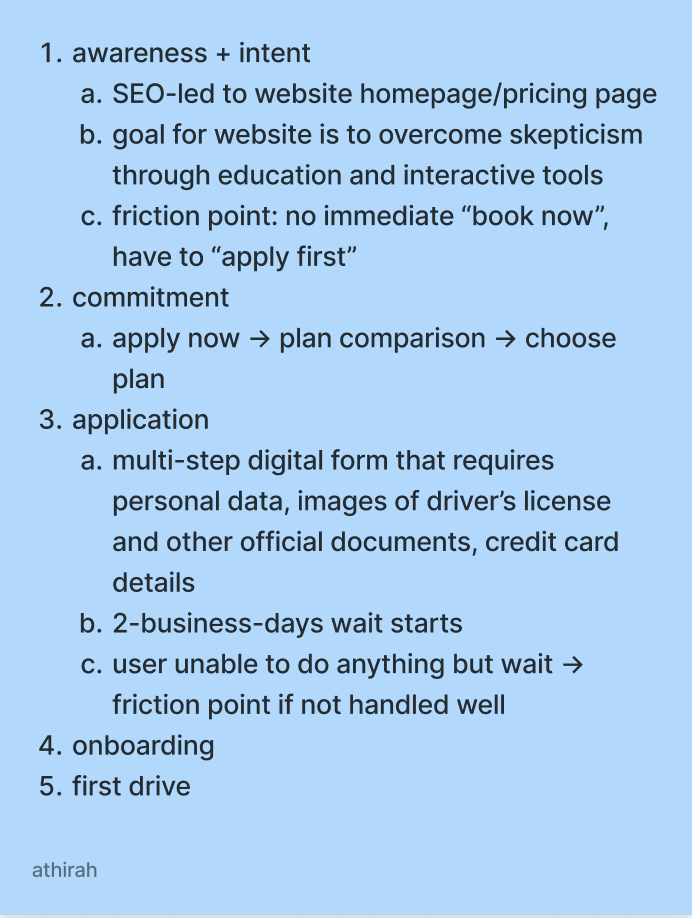

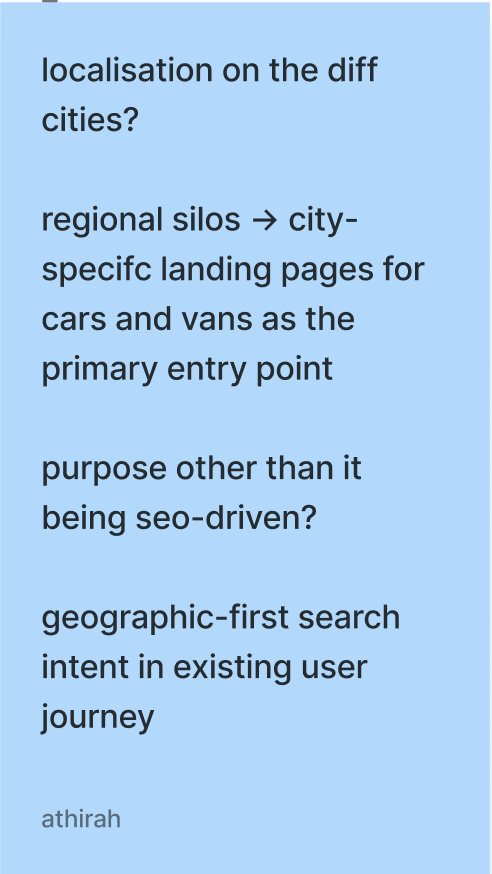
Aligning these insights with brand stakeholders from the local Popcar team, I restructured the site around the four key behaviors.
The new architecture introduced:
- Dedicated landing pages for high-intent topics (e.g vans and specific use cases)
- Clear entry points for location-based discovery (e.g "Find cars near me" as a primary path)
- Contextual CTAs on blog articles that moves users into product validation flows (e.g "Browse vehicles near you" or "Book now")
Adapting the GetGo design system
In the interest of time and effort consolidation, I worked within the constraints of the existing GetGo component library while tailoring it to Popcar's business model.


Pricing presentation
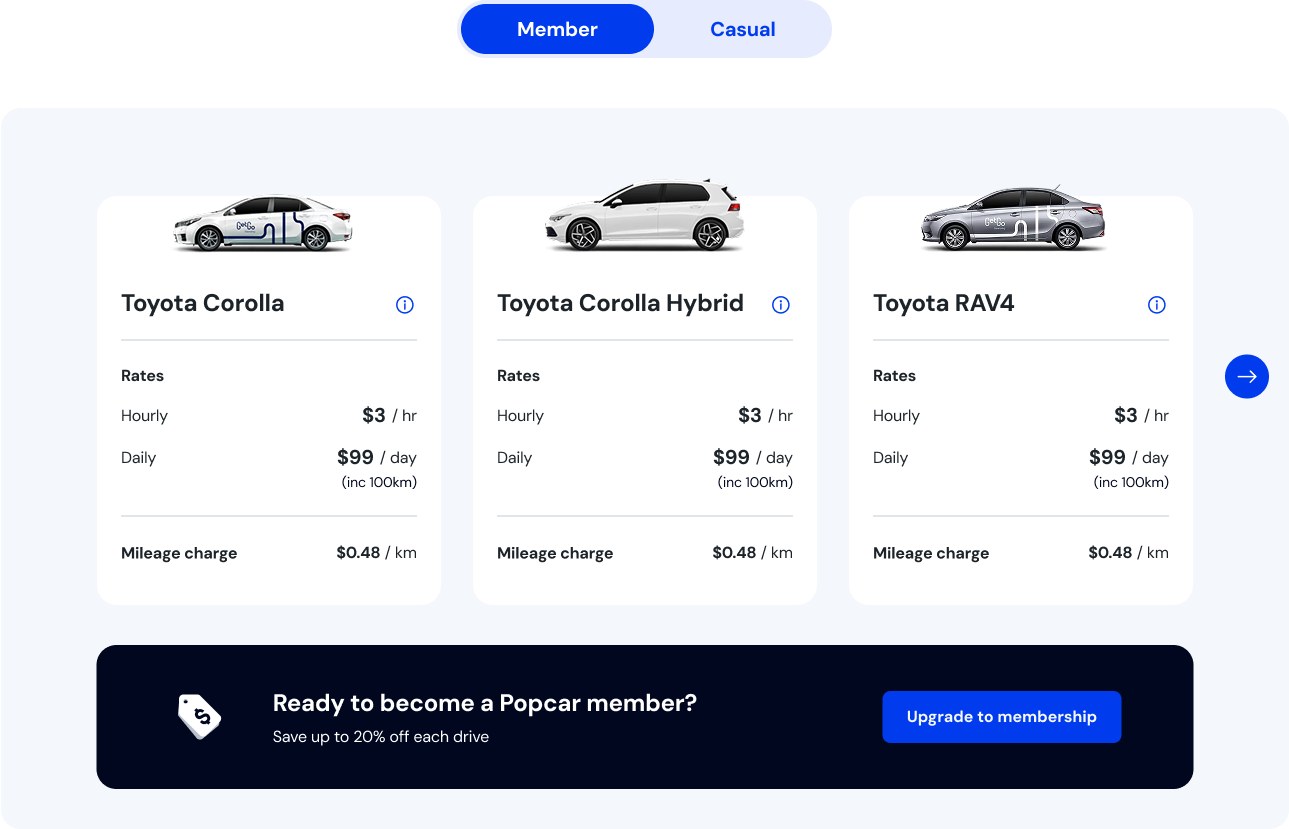
I reconfigured GetGo's existing rates module to simplify Popcar's complicated comparison between the $20 Membership and $0 Casual plan across different vehicle types and time periods.
Vehicle-specific hero pricing
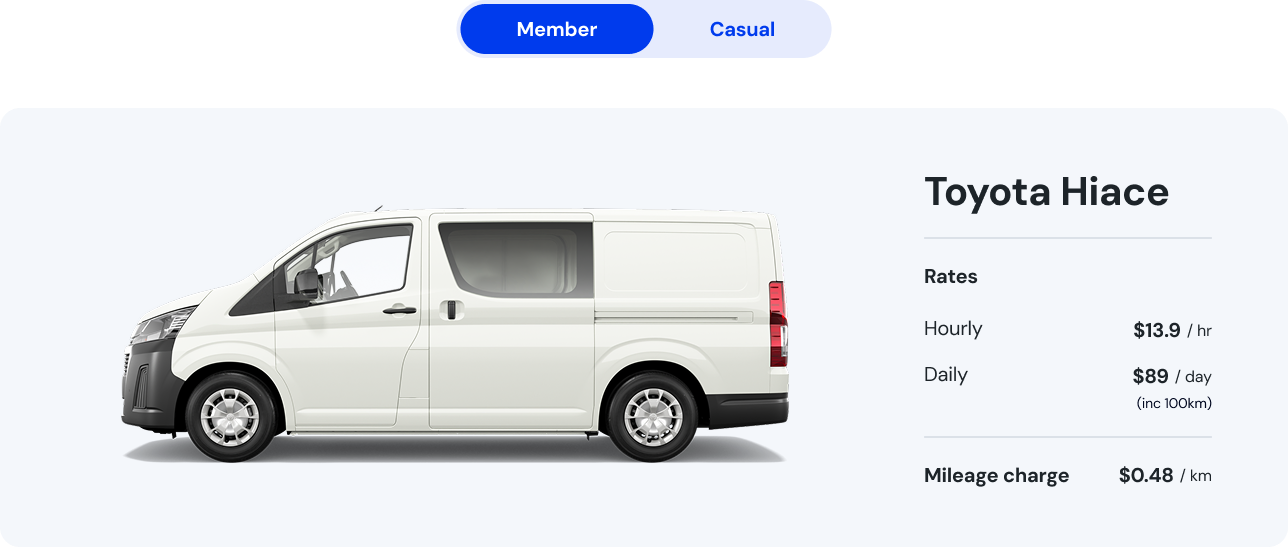
Instead of requesting net-new components, I repurposed the same rates module as a vehicle-specific hero section for acquisition campaigns, preserving consistency while supporting targeted content.
System audit and token consolidation
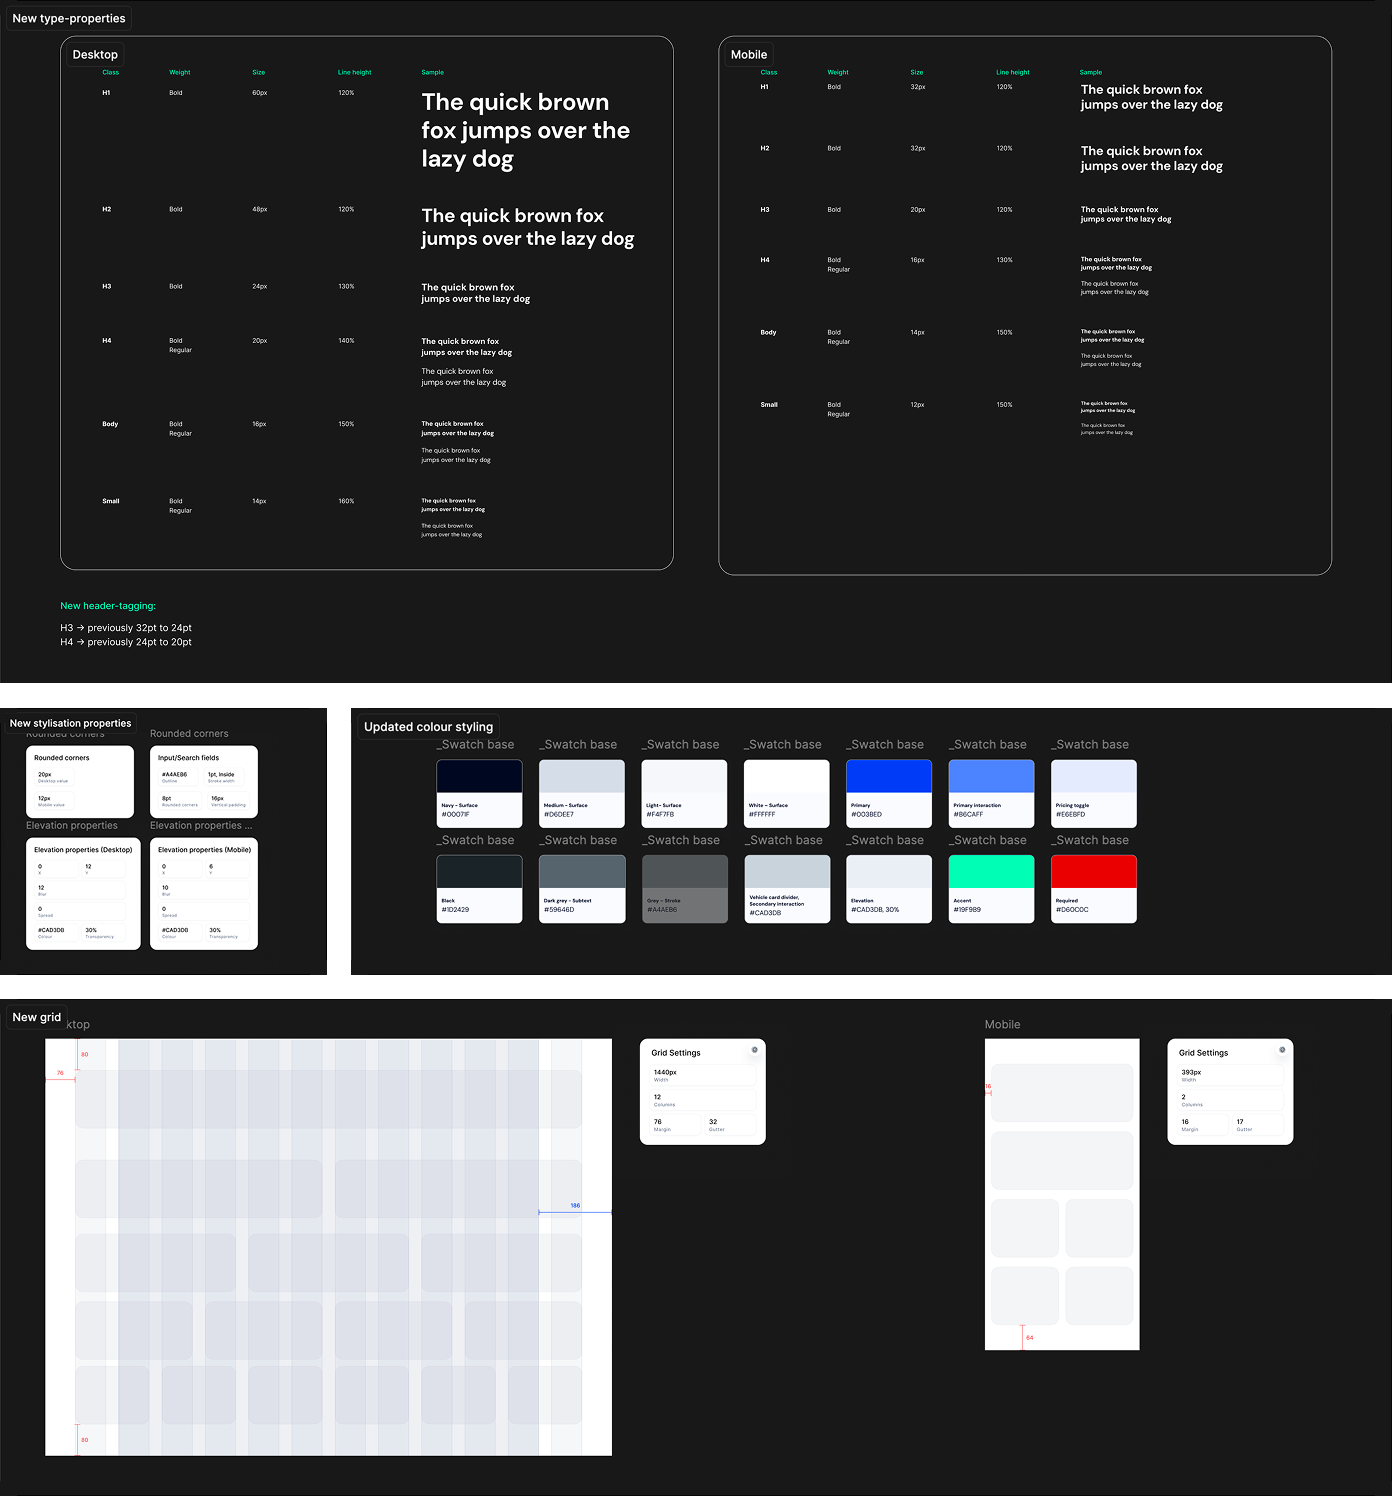
During the migration, I uncovered inconsistencies in inherited GetGo styles:
- Typography scale mismatches
- Colour tokens that didn't map cleanly across pages
- Irregular grid usage and spacing scales
A full design system refactor was out of scope, but I used the migration window to consolidate styles into a cleaner global token structure. I
- standardized type and color tokens,
- mapped legacy values to updated tokens, and
- documented these mappings so developers could roll out global updates via the CMS instead of relying on page-level overrides.
This improved maintainability and reduced future design debt without expanding the official scope. Upon design hand-off, I mapped legacy URLs to the new architecture to preserve SEO equity, and defined and tested for sub-3-second page load targets to reduce bounce rates for Australian mobile users in low-connectivity areas.
Outcome
- Launched on Webflow in Jun 2026 with a clarified, behaviour-led IA, on schedule and within the existing design-system scope
- High-intent traffic had a direct, clearer path to vehicle listings; blog content routed into conversion flows via contextual CTAs for the first time
- Popcar shut down in Oct 2026, after four months of the website being live. I couldn't retrieve the GA4 data after, so this case study leans on the design decisions rather than a conversion-rate comparison – reading behavioural data, making strategic decisions based off them, and handing off and shipping a fully-spec'ed website within design constraints.
Final thoughts
If we had more time, I would have scoped a small round of user validation on the four behavioural segments before committing to the new IA.
The GA4 data told us what users were doing, but I was still mostly inferring why – a round of intercept interviews would have validated my findings, or provide better insight (especially for an unfamiliar demographic).
I'd also have loved to fold the token consolidation work into a proper design-system update instead of a migration-window cleanup, since some of those inconsistencies are still sitting on GetGo's own site.